9 Grocery Items That Have Shrunk the Most Due to “Shrinkflation”
Grocery prices in the United States surged between 2019 and 2023, and federal tracking data shows package size reductions contributed to those increases across multiple product categories. Independent economic analysis found that measurable portions of grocery price increases were directly tied to smaller product sizes. Manufacturers often reduce weight, volume, or count while keeping packaging similar and shelf prices steady.
Consumer research shows that about half of shoppers are aware of shrinkflation or actively concerned about it. Here are a few products most impacted by the process.
Household Paper Products

Image via Canva/Aflo Images
Paper goods rank among the hardest hit categories. Data shows that roughly 10 percent of price increases in this category are directly tied to shrinkflation. Some toilet paper rolls lost close to 100 sheets while the packaging looked identical. Paper towels and napkins followed similar patterns, which makes bulk buying less predictable when comparing value per sheet.
Snack Chips And Salty Snacks
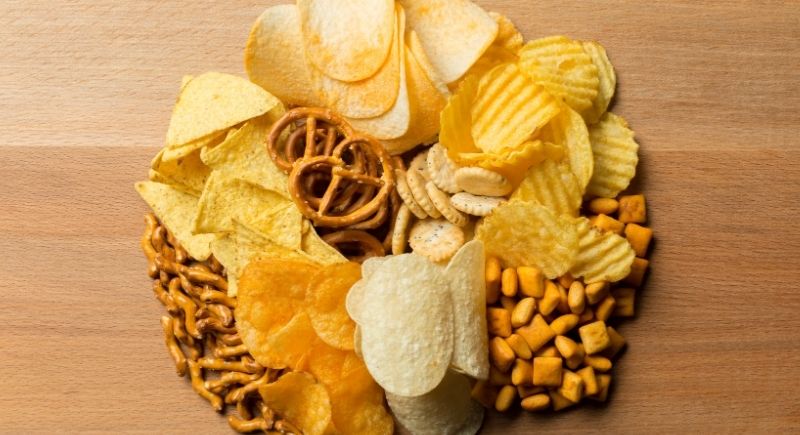
Image via Getty Images/FabrikaCr
Snack categories show nearly 10 percent of price growth linked to size reduction. Major chip brands admitted that bag weight dropped, sometimes by about half an ounce or more. Some tortilla chip bags lost about five chips per package.
Breakfast Cereal
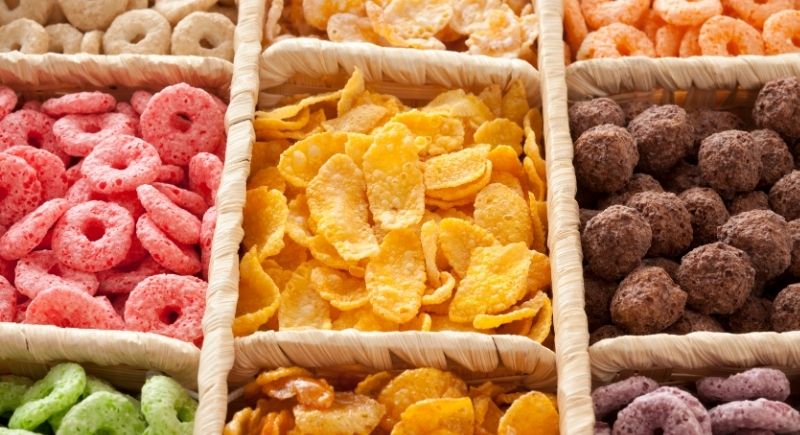
Image via Getty Images/FotografiaBasica
Family-size cereal boxes lost ounces while box height often remained similar, with some products dropping several ounces across recent years. In certain cases, box labeling changed and made size comparisons on shelves harder. This tactic makes price-per-ounce tracking more important, especially for families who buy cereal weekly.
Ice Cream And Frozen Desserts
Ice cream packaging shows some of the clearest examples of shrinkflation. One well-known dairy brand reduced the container size from 56 ounces to 48 ounces while keeping prices stable. Category data also shows about 7 percent of price increases linked to shrinkflation. Frozen desserts often hide size cuts inside redesigned cartons.
Candy And Chocolate

Image via Getty Images/Saltov
The chocolate and candy categories show similar patterns, with some chocolate bars losing around 10 percent of their total weight. In other cases, multipacks shrank while individual bars stayed consistent. Research shows roughly 7 percent of price increases are tied to shrinkflation.
Coffee
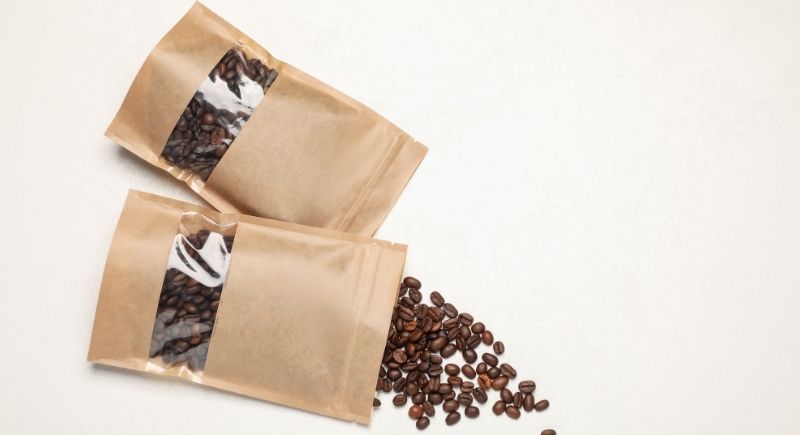
Image via Canva/Africa images
Coffee shows steady downsizing across both large brands and specialty roasters. Some major canned coffee products dropped several ounces while still advertising similar cup yields. Category data shows that about 7 percent of price increases are linked to shrinkflation, and smaller bag sizes have also become common across premium coffee brands.
Yogurt And Dairy Snack Cups
Single-serve yogurt portions show a long downward trend. Older standard cups measured around 8 ounces. Many modern snack-style yogurt products now sit near 4.5 ounces. Some add-in yogurt products reduced yogurt volume even more to make room for toppings while maintaining cup size.
Baking And Pantry Staples

Image via Canva/Stoica Adrian’s Images
Baking mixes and pantry staples show subtle but noticeable changes. Certain cake mixes lost roughly two ounces or more while still requiring the same wet ingredient measurements. Pasta packages also dropped below traditional one-pound standards in some cases.
Frozen Vegetables And Canned Proteins
Frozen vegetable bags show cuts close to 20 percent in some cases, dropping common sizes like 16 ounces closer to 12 ounces. Canned tuna also shows a long history of size reduction, moving toward 5-ounce standards after larger cans dominated shelves decades ago. These changes affect recipes that rely on standard can sizing.